Capturing and Using Scientific Data Provenance

Barbara Lerner
Elizabeth Fong
Mount Holyoke College
Emery Boose
Aaron Ellison
Harvard Forest
Margo Seltzer
University of British Columbia
Thomas Pasquier
University of Bristol
Joe Wonsil
Carthage College
Orenna Brand
Columbia University

Viewing Provenance with provViz

provViz is a tool that allows the user to view and query provenance graphs. It has the following functionality:
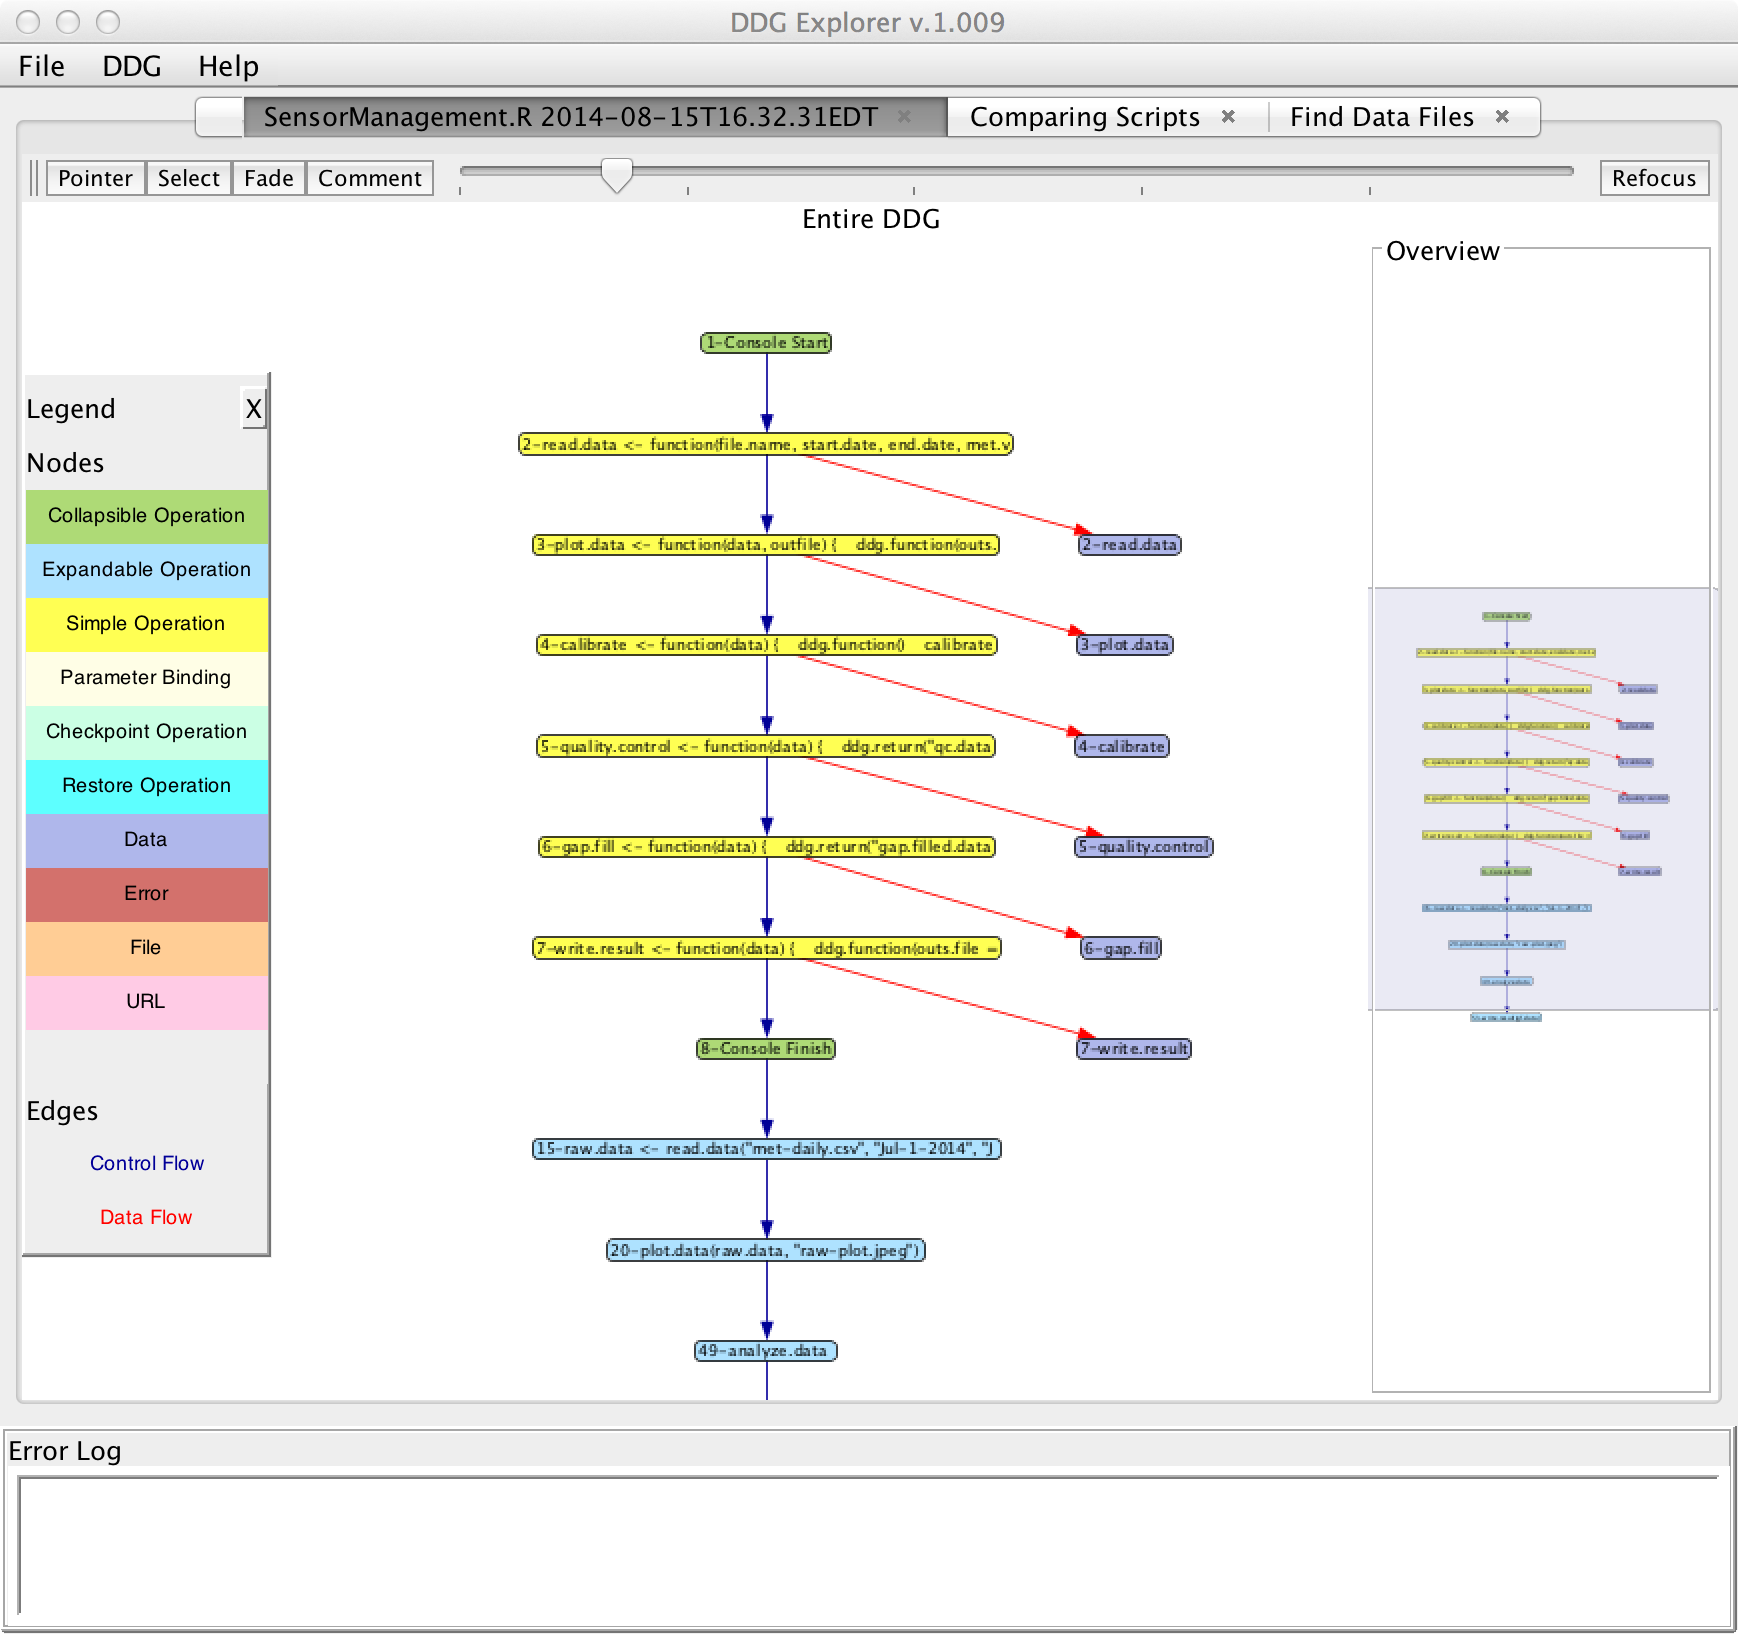
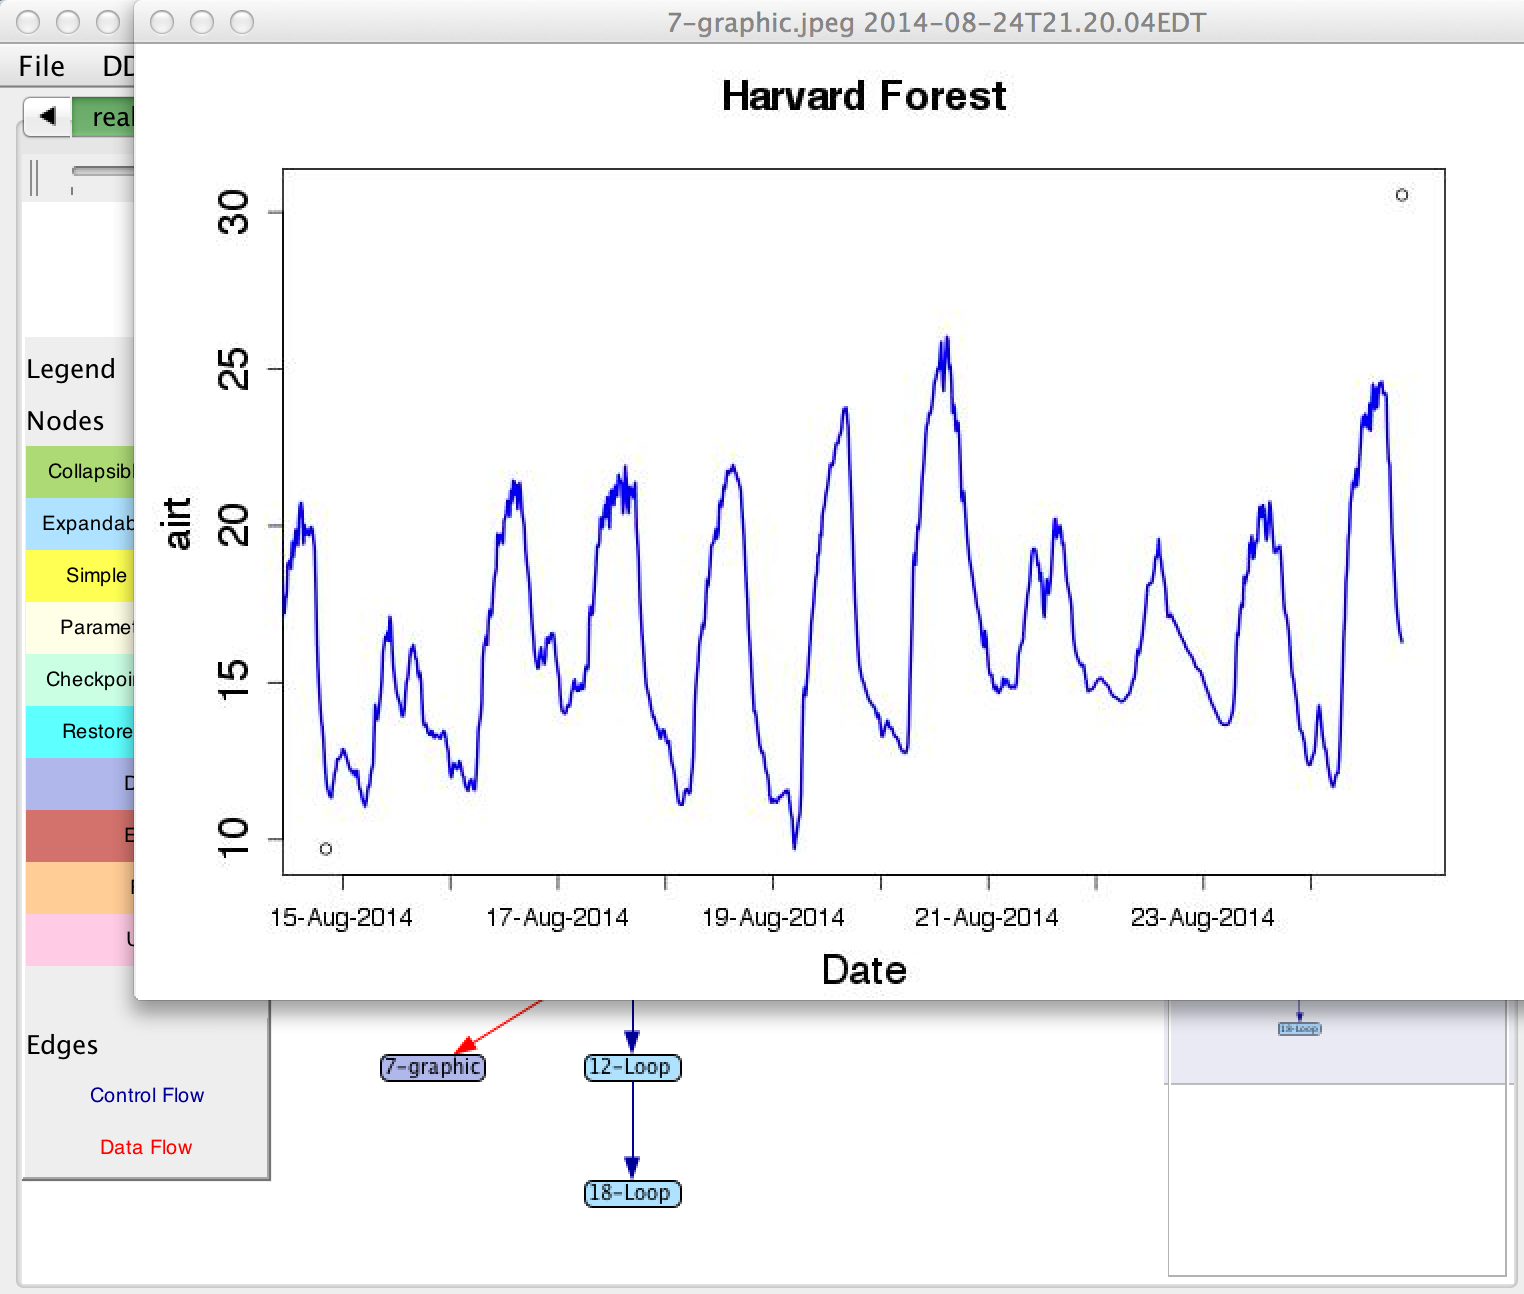
  • Visualization of the graphs, with the ability to expand and contract portions of the graph to selectively show or hide details.
  • Ability to view the data or R functions referenced in the provenance
  • Ability to query the provenance to discover how an input data value gets used, or what data and processing steps lead to the derivation of a particular output value
  • Ability to compare R scripts used to generate different graphs
  • Ability to search for where a particular data file is used or generated.
provViz screenshot

Expanding and contracting abstraction layers

One of the key innovations of provViz is the ability to capture abstraction and allow users to view their graphs at an abstract level or expand abstracted nodes to reveal more detail.
Most abstract view Expanding analyze.data Expanding calibrate and plot.data
Abstract provenance graph Partially expanded graph Expanded graph

Connecting to the Data and R Scripts

The nodes in the graph retain connections to the scientific data, the R scripts and plots produced. By clicking on nodes in the graph, the user can see the values as they existed at that point in the computation.

provViz is an R wrapper around DDG Explorer, which requires Java 1.7 or later.

Plot